Eli Lilly's Zepbound Data
Introduction
While my group initially focused on consumer behavior in business, I wanted to explore Eli Lilly's product data. To narrow this down into a specific sub-domain, I will collect revenue data on their GLP-1 drug, Zepbound. I hope this website will show how Zepbound's revenue changed overtime and potential conclusion we can draw from this.
Data
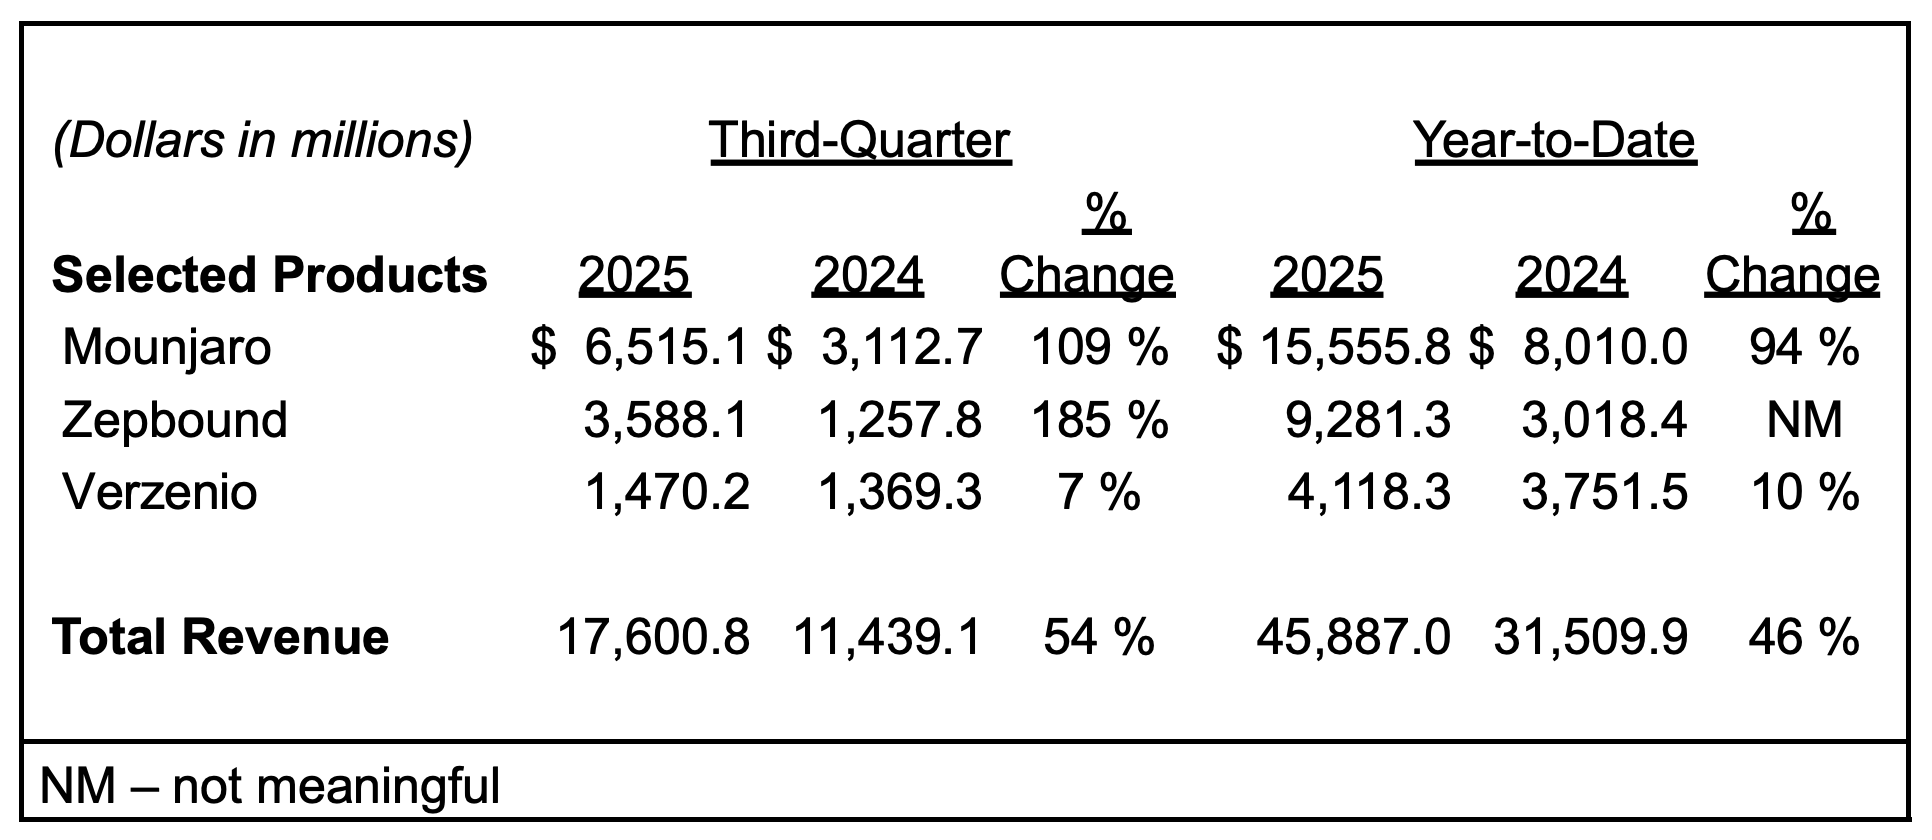
Eli Lilly's Zepbound product data comes from their quarterly financial reports. This is an example of their 2025 Q3 report that documents Zepbound's sales amount (alongside other drugs they make).
Turning Data into Charts
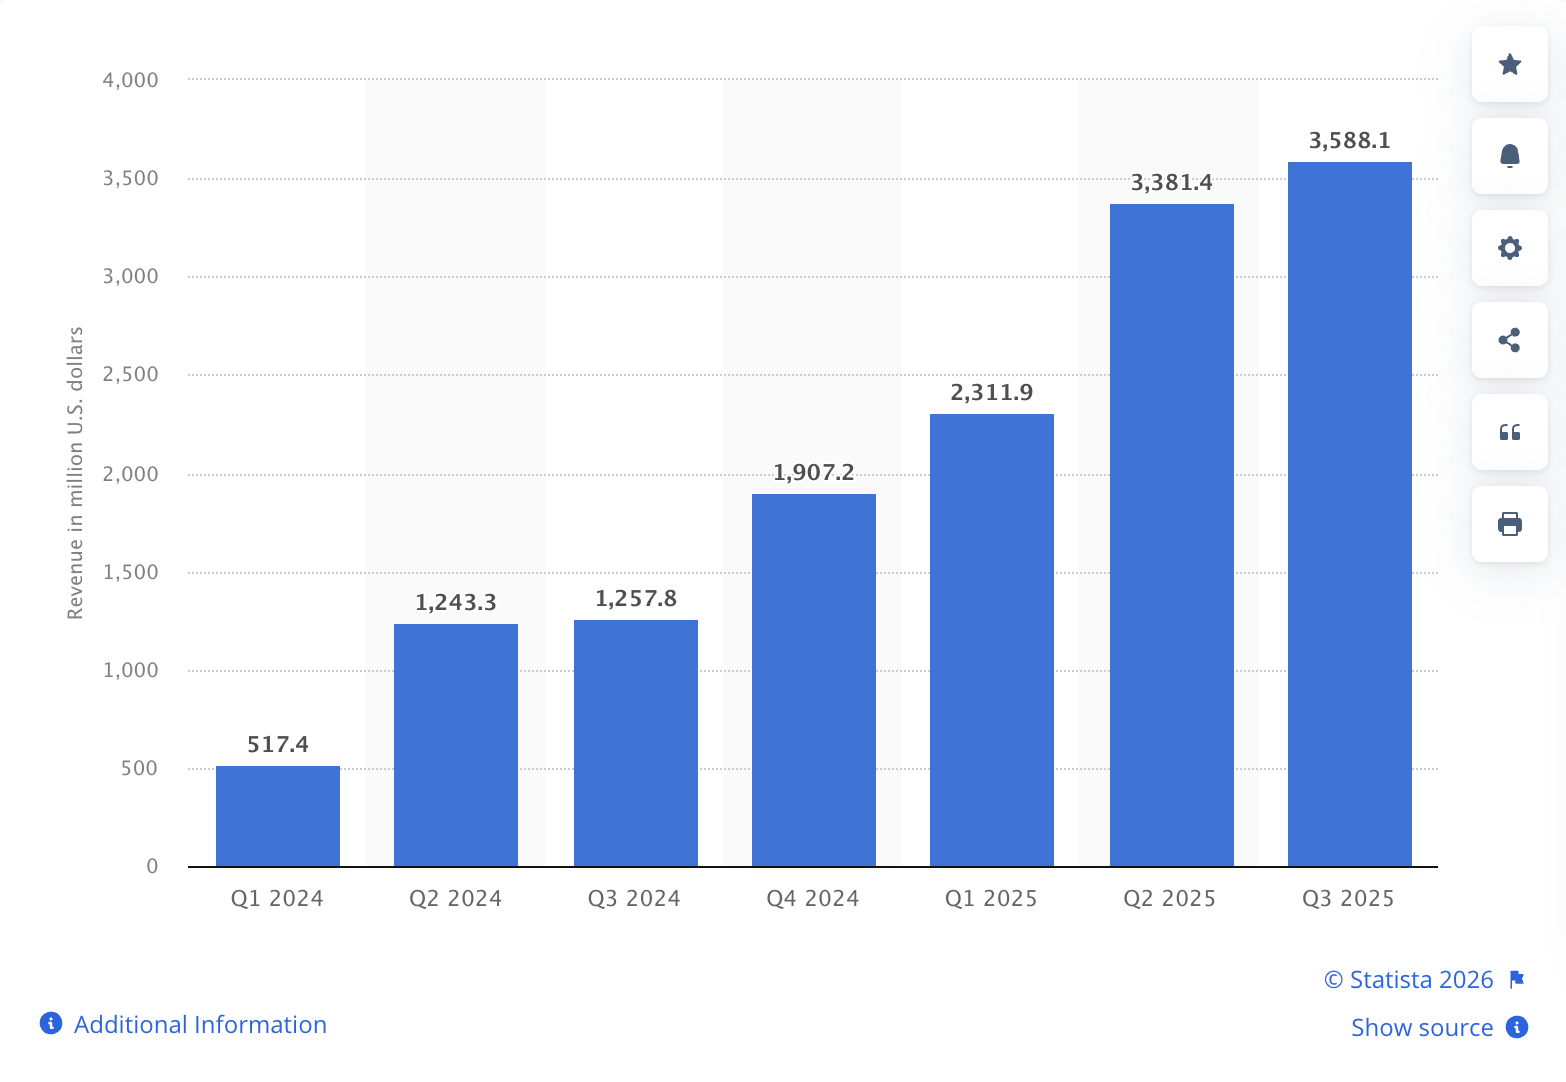
One of the nicely created ways to visualize Zepbound's growth is through Statista's chart (displayed below) showing "Zepbound revenue of Eli Lilly and Company from first quarter of 2024 to third quarter of 2025." I like this chart because it shows their growth really easily.
Another chart I found was produced by Eli Lilly themselves. This is their growth of Zepbound in each month (a bit more broken down than Statistica's quarterly reports). I really like this because of how detailed it is and I love how they compare the results with the rest of the market because Zepbound's growth is really put into perspective.
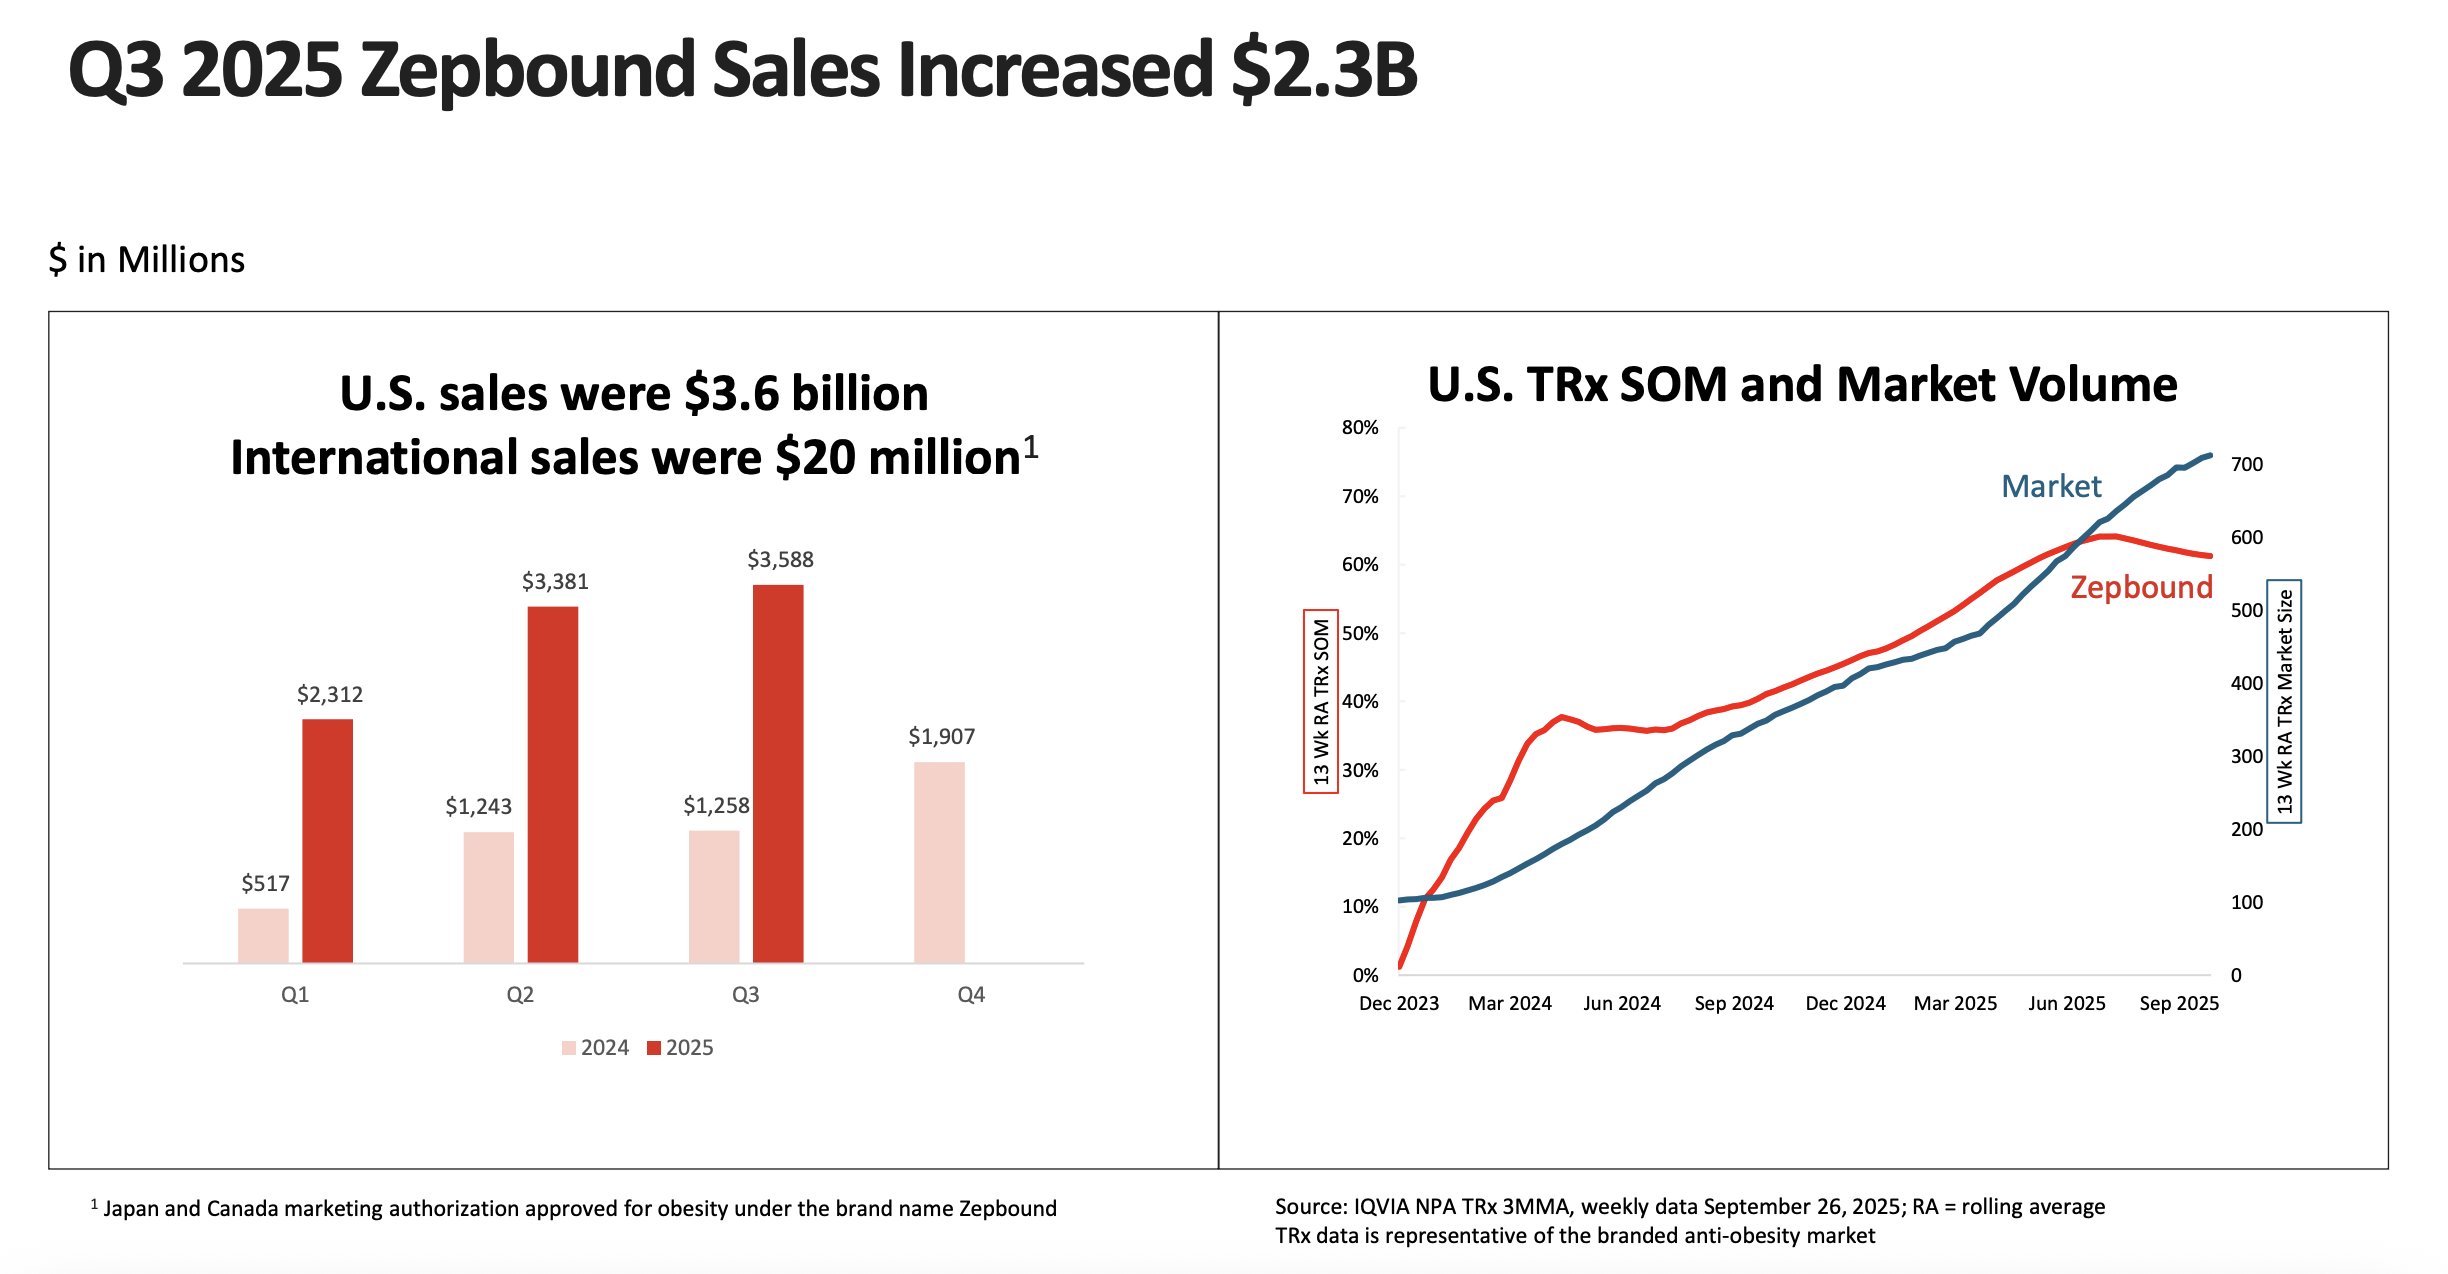
Something that people can notice may be the upward curves of the revenue; however, it is important to point out that the rate of growth in 2024 was greater than the rate of growth in 2025. Despite this, Zepbound's revenue is still growing strong, with the market mirroring these upward trends.
Insights from this Data
As a company, looking at the chart to see that the sales for Zepbound have been falling in the last quarter of 2025 - while the market SOM is increasing - could be a red flag to Eli Lilly. It may indicate that customers are venturing to other companies/solutions for GLP-1 weight loss alternatives.
After researching a bit, one possible reason to explain this is the increase in sales in competitor Novo Nordisk's weightloss drug, Wegovy. Moreover, Eli Lilly's own Mounjaro or Novo Nordisk's Ozempic could also be taking away customers (which although they're technically approved to be used as treatment for diabetics, they're often also used as a weight loss drug).
Action Items
If people continue to venture away from Eli Lilly's Zepbound, they must find new innovative solutions to bring people back to their company.
Interestingly enough, Eli Lilly's upcoming new pill version of a weightloss drug (called Orforglipron) may do this as it will offer a less invasive way to administer the drug (oral rather than injection).
Improvements to the Visualizations
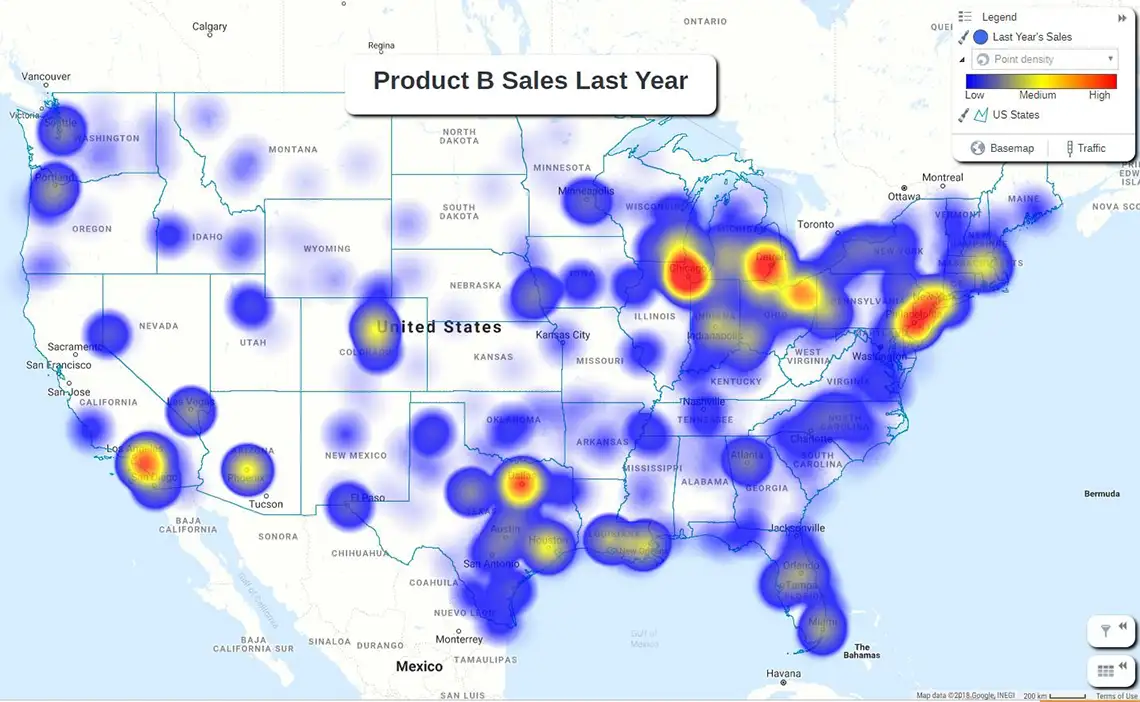
If I were to design a data visualization chart for Zepbound product sales specifically, I would want to design a map of the world to see where the most product sales are coming from. If I were to design it, I would hope to design it similar to a heat map: placing dots for every sale with the opacity of the dots being darker (or the size of dots being bigger) for more concentrated areas. I think this would give really strong insight to the direction that Eli Lilly should be marketing their products (for instance, if the majority of people live in LA, maybe they could lean into LA's health and wellness culture/trends of being slimmer). I think adding other competitors/other GLP-1 drugs Eli Lilly makes would also be a helpful inclusion on this chart to understand the GLP-1 market better.
Up above is an example of what I would want to do for Zepbound's data visualization.
Alternatively, if I could modify Eli Lilly's chart in the "Turning Data into Charts" section, I would add their other drugs on the chart alongside top competitors. I also would not have SOM on the y-axis, but instead sales in dollars because it would give a more clear picture of how the product sales are distributed.
Sources
Amersi, Shamsah, MD. "Ozempic, Wegovy, Mounjaro & Zepbound: What's the Difference?" DrAmersi.com, https://www.dramersi.com/blog/ozempic-wegovy-mounjaro-zepbound-whats-the-difference
Eli Lilly and Company. "Lilly reports third-quarter 2025 financial results, highlights R&D pipeline momentum and raises 2025 guidance". Lilly Investor Relations, investor.lilly.com/node/53191/pdf
Eli Lilly and Company. "Q3 2025 EARNINGS CALL." Lilly Investor Relations, investor.lilly.com/static-files/81645112-510f-4ce8-a860-c74596c1caa2
eSpatial. Sales Performance Comparison Using Heat Maps (Image). eSpatial, www.espatial.com/hubfs/sales-performance-comparison-using-heat-maps-product-b.webp
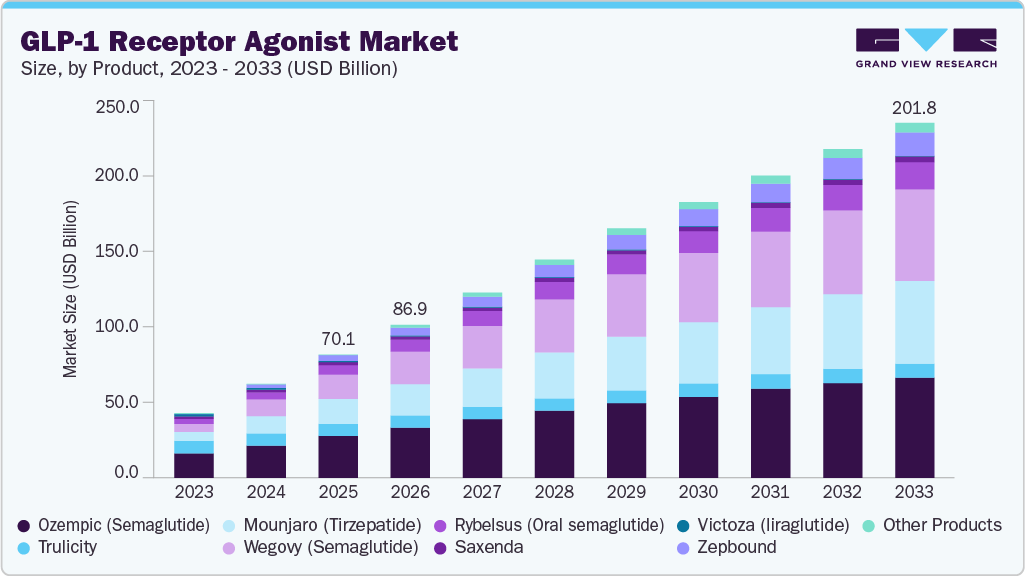
Grand View Research. GLP-1 Receptor Agonist Market Size, Share & Trends Analysis Report, 2026-2033. Grand View Research, www.grandviewresearch.com/industry-analysis/glp-1-receptor-agonist-market
Statista. "Zepbound Revenue of Eli Lilly and Company (LLY) Predominantly Used for Weight Management." Statista, www.statista.com/statistics/1636037/eli-lilly-zepbound-revenue/